🗺️ Dashboard
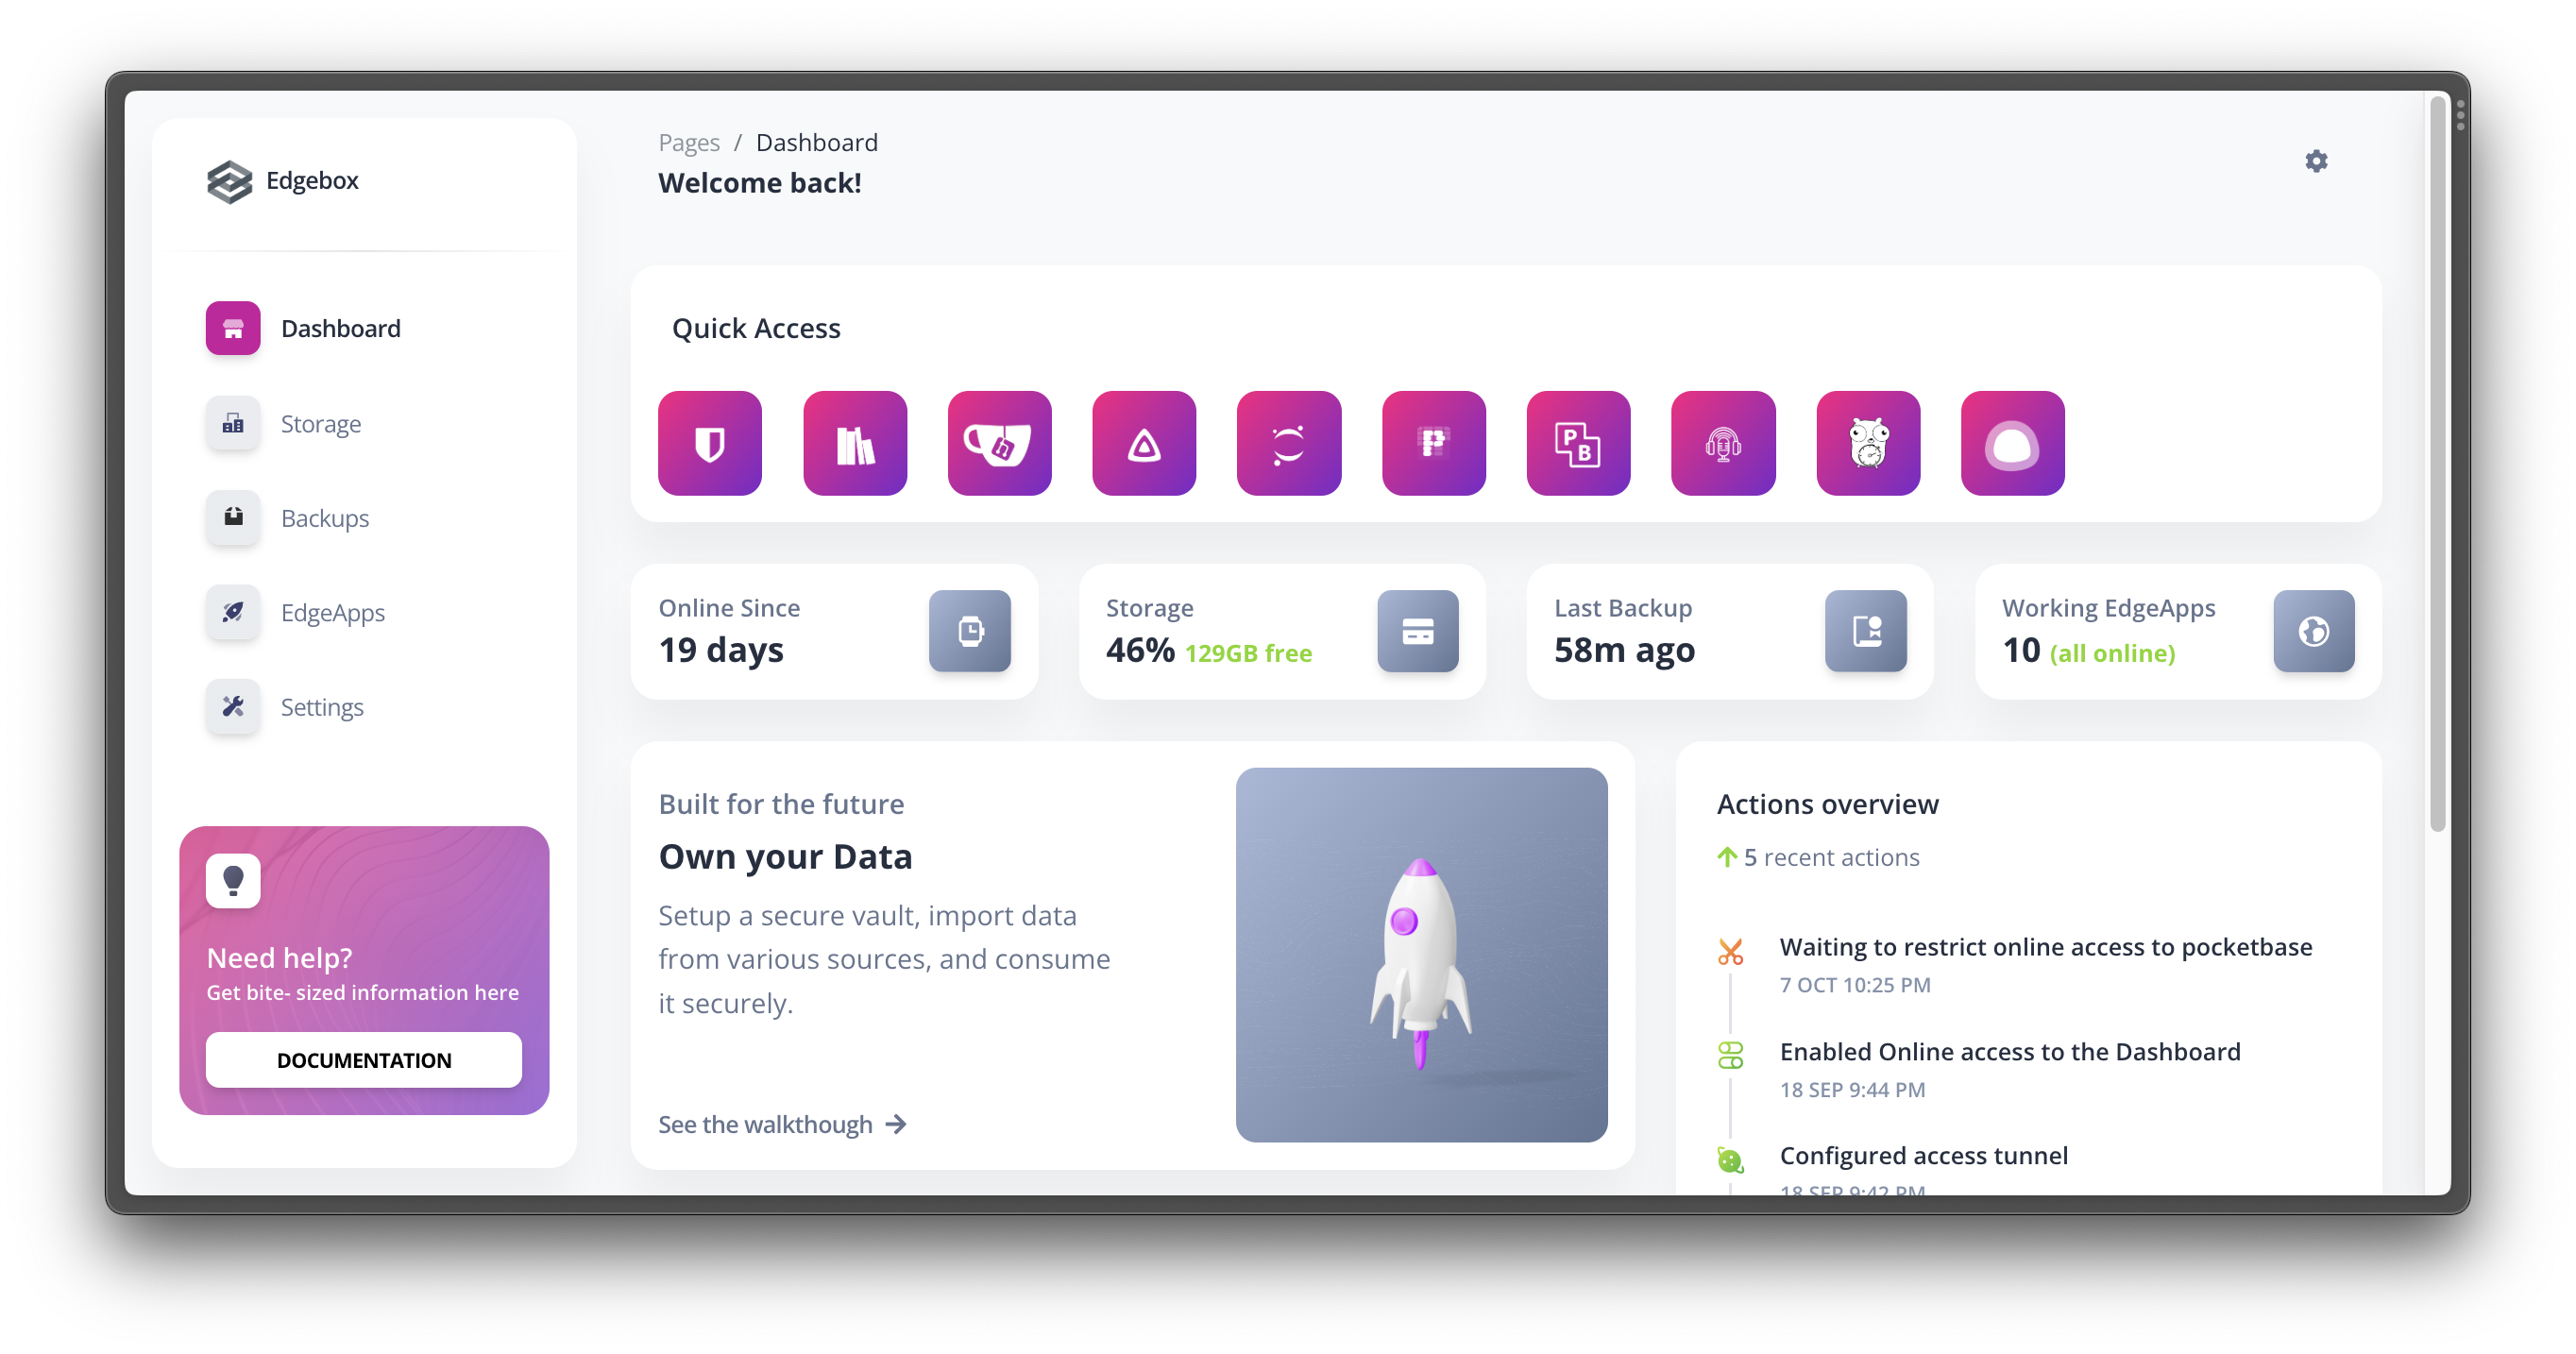
The dashboard is the main interface for the Edgebox system. It provides a simple way to control it and access the various features and applications.

The system should execute continuously, and be accessible via the web interface either in the local network or via the internet.
🔗 Accessing the dashboard
To access the dashboard, open a web browser and navigate to http://edgebox.local when the server is in your local network. If you previously configured a custom domain, you can also use that domain to access the dashboard, even when not in the local network. Check the external access page for more information.
Info
If you are using the Cloud version of Edgebox, you can access the dashboard at https://<username>.edgebox.io (replace <username> with your username)
The first time you open the dasboard, you will be asked to introduce a username and password, that will be used to secure access.
📊 Dashboard sections
Sidebar menu
The sidebar menu is the main navigation menu of the dashboard. It allows you to access the various sections of the dashboard (Storage, Backups, EdgeApps and Settings). It also allows you to access the documentation and the support pages.
Quick access
The quick access section allows you to quickly access all active apps on the main dashboard page. A quick click on the app icon will open the app in a new tab.
Overview Cards
The overview cards give you a quick overview of the status of the system. They show how long is edgebox running since its last restart, the status of the storage, backups, and edgeapps.
Actions Overview
The actions overview section allows you to quickly check the last actions taken in the system. Any action that changes the state of the system will be logged here.